Check Monitoring
View real-time performance metrics of your shared GPU in graph format.
Tip
Use the monitoring feature to check GPU usage, memory, network traffic, and more in real time or over a selected time period.
How to Access Monitoring
- Click the Monitoring button on the shared GPU information screen.
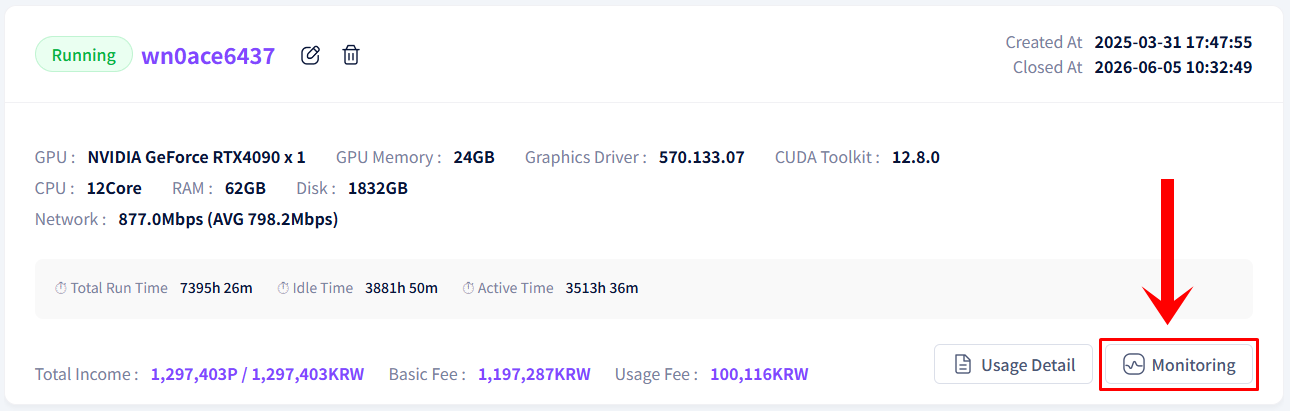
- The full node monitoring overview screen will be displayed.
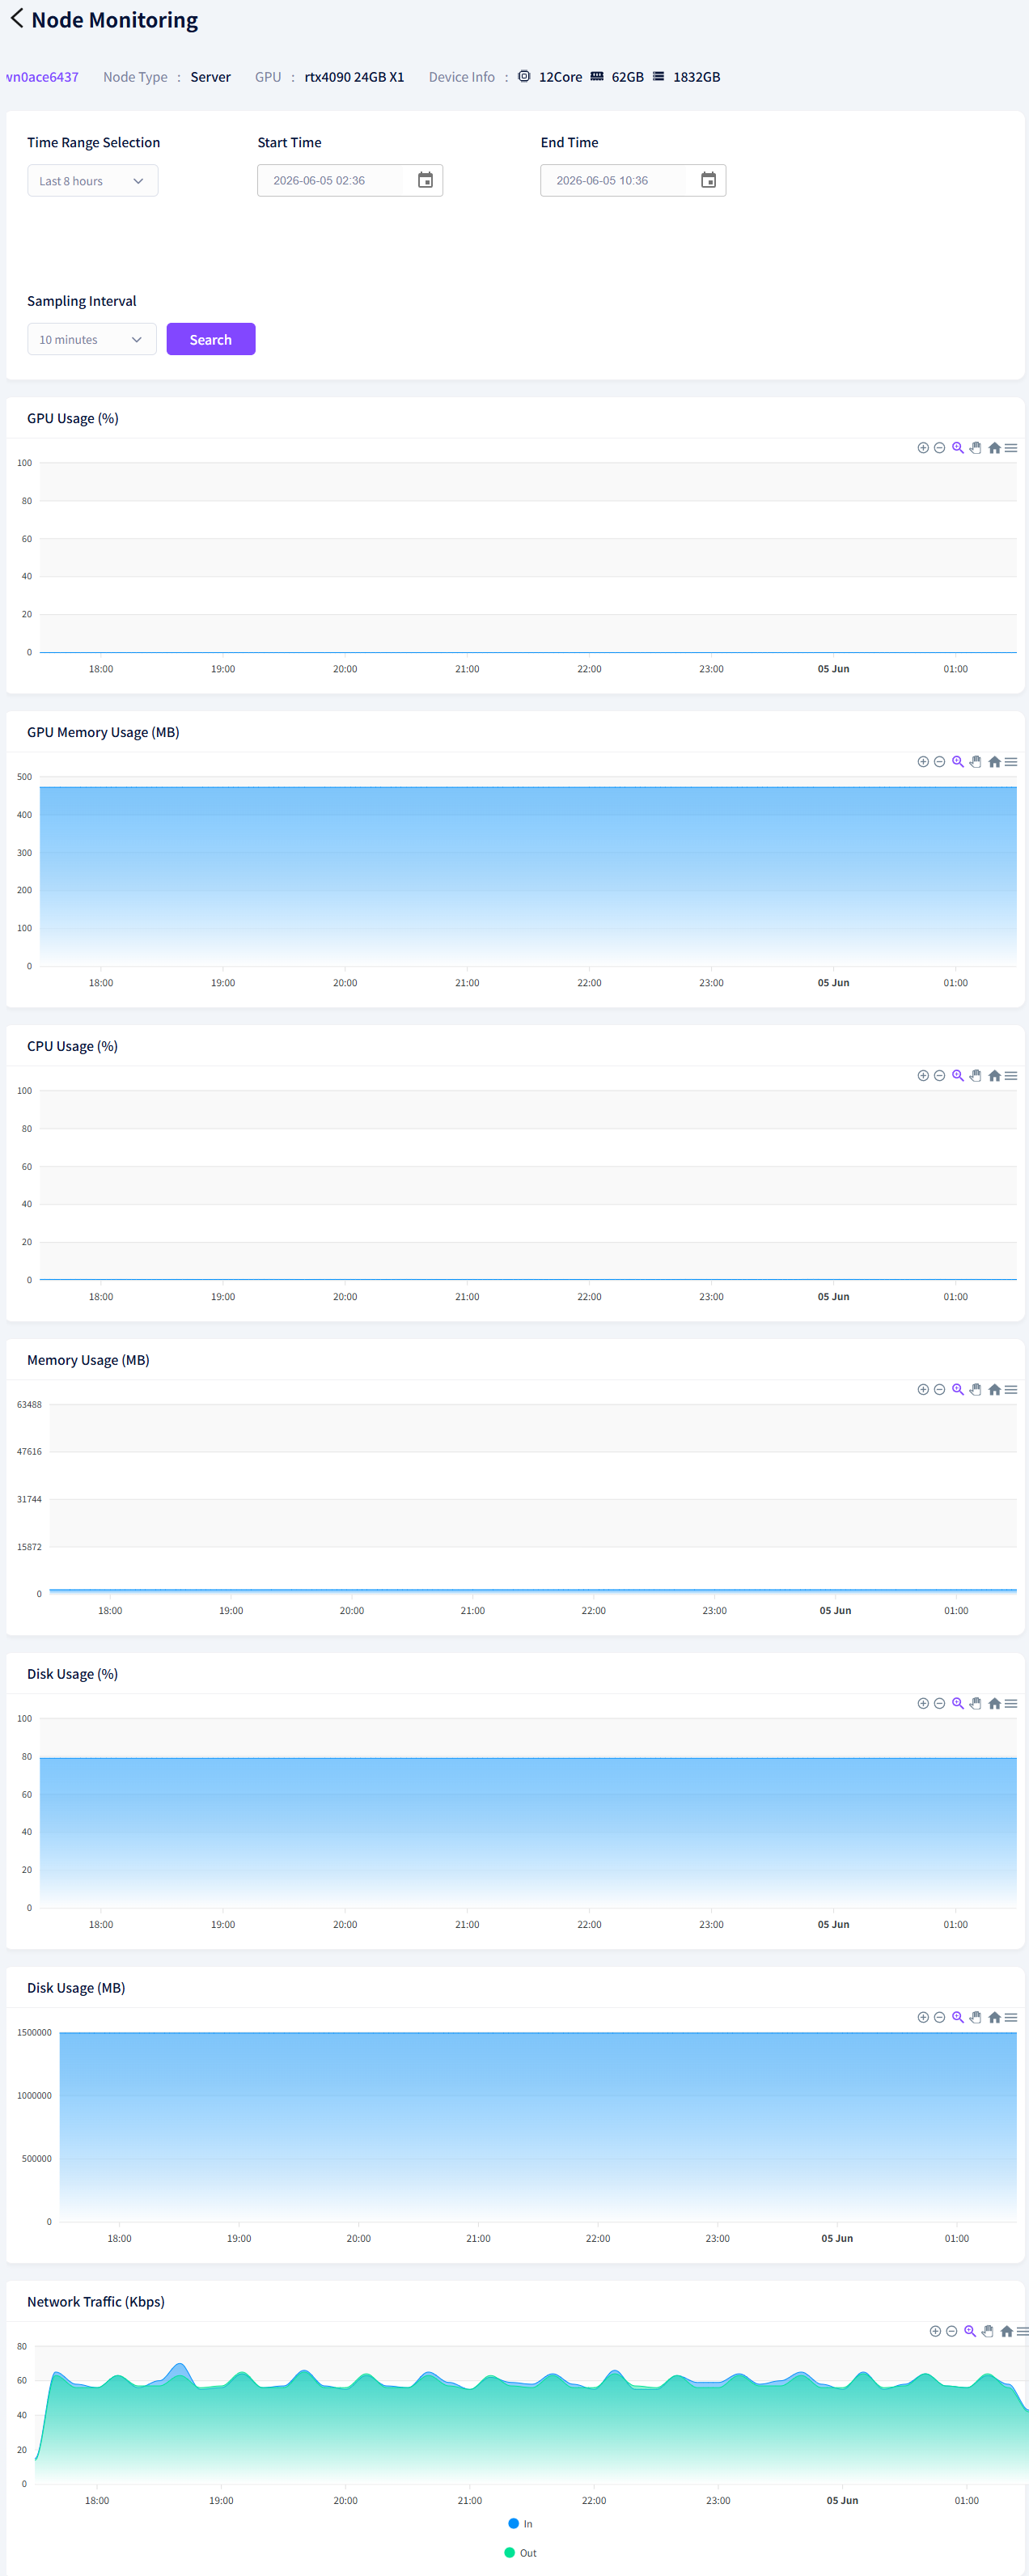
Available Metrics
| Metric | Unit |
|---|---|
| GPU Usage | % |
| VRAM Usage | MB |
| CPU Usage | % |
| Memory Usage | MB |
| Disk Usage | MB |
| Network Traffic (Inbound/Outbound) | Kbps |
Setting the Time Range
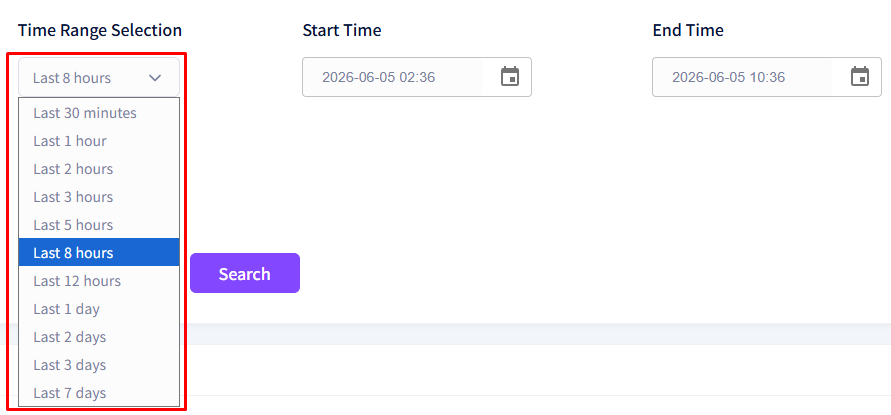
- Click the time range selector to choose from predefined time periods.
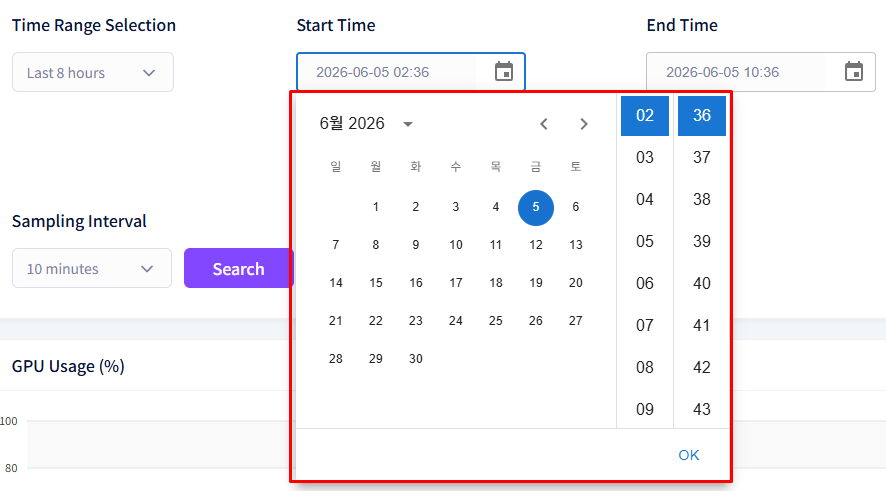
- Select a custom time range to specify the start and end times manually.
- Use the sampling interval button to adjust the time unit of the graph.
Default: 10 min / Minimum: 1 min / Maximum: 5 hours